
What is Metricool Studio?
Metricool Studio is an AI-powered reporting engine that transforms your social media data into Analytics Views. Using natural language instructions or its guided mode, it generates structured reports tailored to your needs, such as competitor analysis or month-over-month performance comparisons against the previous year.
In just a few seconds, it creates a view with charts, data tables, and AI-generated insights to help interpret your metrics.
In addition to analytical reports, Metricool Studio also lets you create Calendar Views to plan and schedule content for one or multiple brands at the same time.
These views can be shared with clients through a public link without requiring a Metricool account.
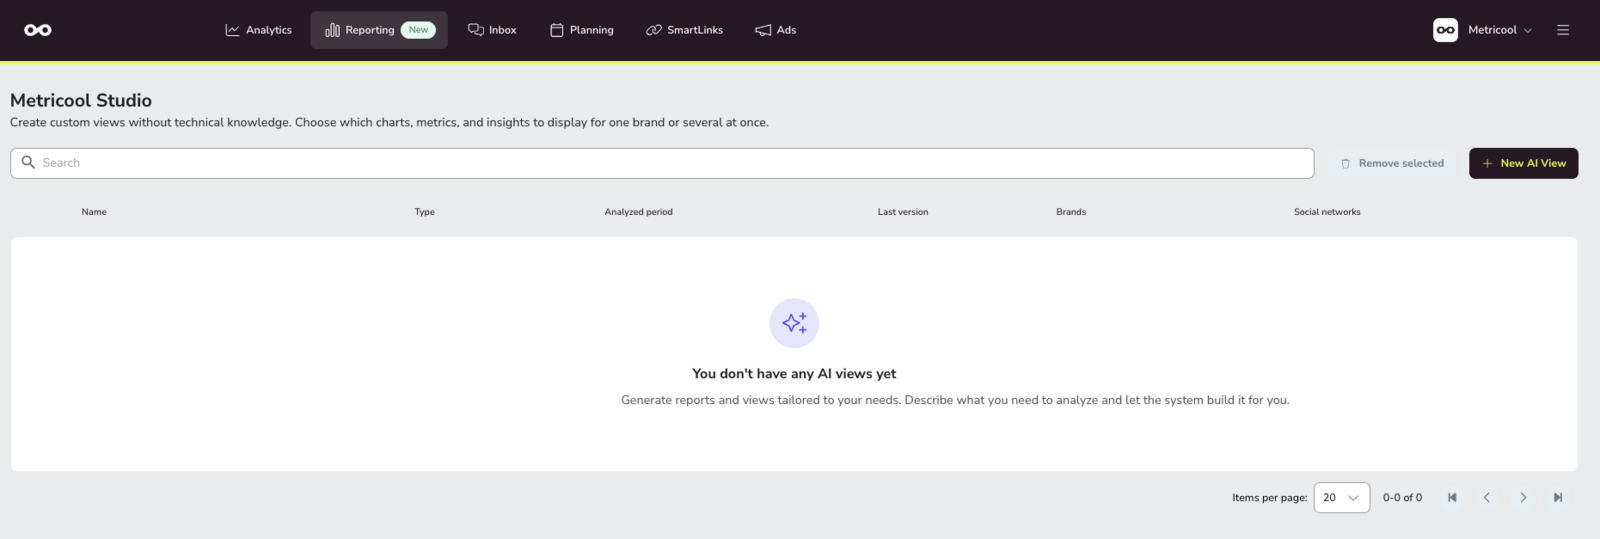
Where to find Metricool Studio
Go to Reporting in the top menu. In that section you will find:
Reports
Campaign Dashboards
Metricool Studio
Looker Studio
Metricool Studio is not available on mobile. Only Standard Reports can be accessed from the Metricool mobile app.
What can Metricool Studio do for you?
✅ Understand performance faster
Get automatic charts and written summaries covering reach, engagement, followers, content performance, and more. Metricool Studio doesn't just show you the numbers — it explains what changed and why it matters.
✅ Go beyond standard analytics
Mix brands, networks, and time periods in a single view. Compare this February with last February. Analyze competitors. Identify your best posting times based on your own data — not generic industry benchmarks.
✅ Save time preparing reports
Describe what you want in plain language. Reuse views instead of rebuilding reports every week or month. Duplicate a view that works and change only what you need.
✅ Share results easily
Generate read-only links you can send to clients or collaborators, without giving them full account access. If you use a relative period ("this week"), the link refreshes automatically — no need to resend it every week.
What makes Metricool Studio different from other Metricool features?
Metricool already offers several ways to work with data. Here's how Metricool Studio fits in:
Standard Reports | Analytics | Looker Studio | Metricool Studio | |
|---|---|---|---|---|
Customization | Limited (logo, colors) | No | Full | Full |
Multi-brand & comparisons | No | No | Yes | Yes |
Works inside Metricool | Yes | Yes | No | Yes |
AI insights & recommendations | No | No | No | Yes |
Analytics is for day-to-day data exploration. Reporting (including Metricool Studio) is for building, sharing, and answering deeper questions: campaign analysis, custom dashboards, AI-generated insights, and presentation-ready views.
Metricool Studio and Looker Studio coexist because they serve different needs: if you want full technical control and prefer to work outside Metricool, use Looker Studio. If you want to describe your report in plain language and get results without leaving Metricool, use Metricool Studio.
Who can use Metricool Studio?
Access depends on your plan:
Free plan — Metricool Studio is not available.
Paid plans (Starter / Advanced) — You can use Metricool Studio, but the number of views you can create and your access to version history may be limited.
With the Metricool Studio add-on — Unlimited views, full version history, and additional capabilities. Pricing and availability are estimated for June 2026.
Your ability to use Metricool Studio for a specific brand also depends on your permissions for that brand and for the Reporting section. Brand permissions are checked at every step — prompt generation, visualization, and view listing. If you don't have access to a brand you've selected, the prompt cannot be generated.
FAQs
How much will the add-on cost?
Pricing is still to be confirmed.
When does the add-on launch?
Estimated for June.
What's the difference between Analytics and Reporting?
Analytics is for day-to-day data exploration. Reporting is for building, sharing, and answering deeper questions: campaign analysis, custom dashboards, AI-generated insights, BI-style views.
Can I use Metricool Studio from the mobile app?
No. Only Reports is currently available on mobile.
Can Metricool Studio access external data?
No. Metricool Studio works exclusively with data that Metricool already collects from your connected social media profiles. It cannot pull in data from Google Analytics, your CRM, or other external sources. For external data integrations, use the Looker Studio connector.
Which languages does Metricool Studio support?
You can use Metricool Studio in any language — just write your prompt in the language you want, and the report will be generated in that language. The introductory and insights sections translate reliably. Metric labels in charts and tables may sometimes remain in their original language; translation quality in those sections is best-effort.
Next steps
Ready to create your first view? Learn how to:
Build a Metricool Studio view step by step
Manage, refresh, and duplicate existing views
Share read-only links with clients
Want to see Metricool Studio in action? Watch the demo: → Metricool Studio Webinar