
How to sync and understand your Campaign Dashboard
Updated 2 weeks ago
Learn how to sync your Campaign Dashboard to pull the latest metrics and read the content summary, top posts, and AI Insights.
Syncing metrics
After your content is set, sync the dashboard to load the latest performance data. The status button shows one of three states:
Synchronized (green) — data is up to date
Desynchronized (orange) — needs syncing. Click to open the dashboard and trigger a new sync
Synchronizing — sync in progress
The dashboard header shows a Last update indicator with the date and time of the last sync — hover the ? icon for a quick explanation.
When sync completes, the dashboard generates:
A content summary with a chart
The Top 5 best-performing posts by social metrics
AI Insights (when the dashboard has at least 10 posts)
Data sync and AI Insights generation run as separate steps with separate progress indicators. If Insights generation encounters an error, a warning is shown and any previously generated insights remain visible.
Sync before any client presentation to make sure numbers and insights are current.
Understanding the dashboard
Campaign Dashboards supports collapsible sections to help you navigate long reports more comfortably. Click on any section header to expand or collapse it, making it easier to focus on the metrics that matter most for your presentation.
Dashboard goals
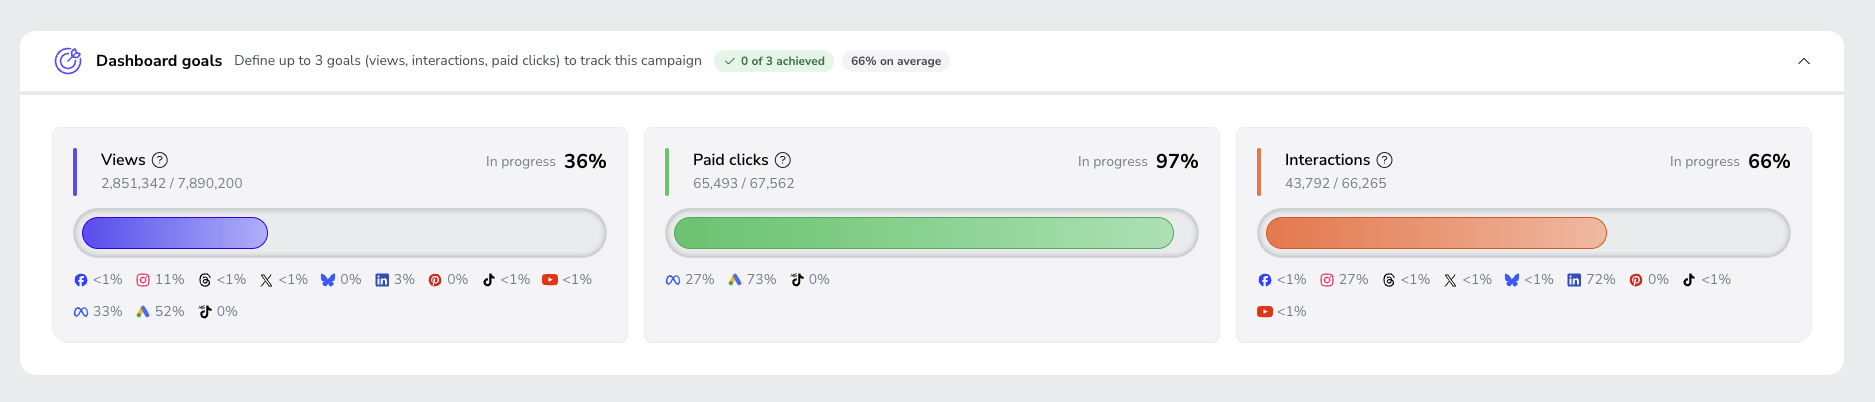
The Dashboard goals section tracks your campaign against the goals you set for views, interactions, and paid clicks. If you haven't set any goals yet, click Define goals to add up to three.
Once goals are set, the section header shows how many goals you have achieved (for example, 0 of 2) and the average progress across all of them. Each goal has its own card with:
Its status, such as In progress, and the percentage reached
The current value against the target (for example, 2 / 200,000)
A progress bar toward the target
The Views goal counts organic and ads impressions together. Hover the ? icon next to a goal name for its definition. To change a goal, click Edit content at the top of the dashboard while the dashboard is still active.
Content summary
An overview of all included content with a chart showing performance distribution across your campaign period and networks. When the dashboard includes Instagram collab posts, the Views and Interactions totals break down your own content separately from Collabs.
Best posts per network
Each network inside your Campaign Dashboard has its own Best posts section, showing the highest-performing content for that specific channel. This section appears when:
The dashboard includes more than one network
There are at least five organic pieces of content
The relevant metric is available for that network
Rank posts by views or interactions to focus on what matters most for your campaign goals. To see the full list of published content instead of only the top performers, use the View posts button on this block.
Overall Top 5 best posts
The five highest-performing posts across all networks in the dashboard. You can switch the ranking metric between impressions and interactions depending on what matters most for the campaign.
View all posts
The View posts button on the best posts block opens a sub-page listing every piece of published content in the dashboard — posts, reels, and stories — each with all the metrics Analytics holds for it. Collab posts are labeled "Collab · @username" so you can tell them apart from your own content.
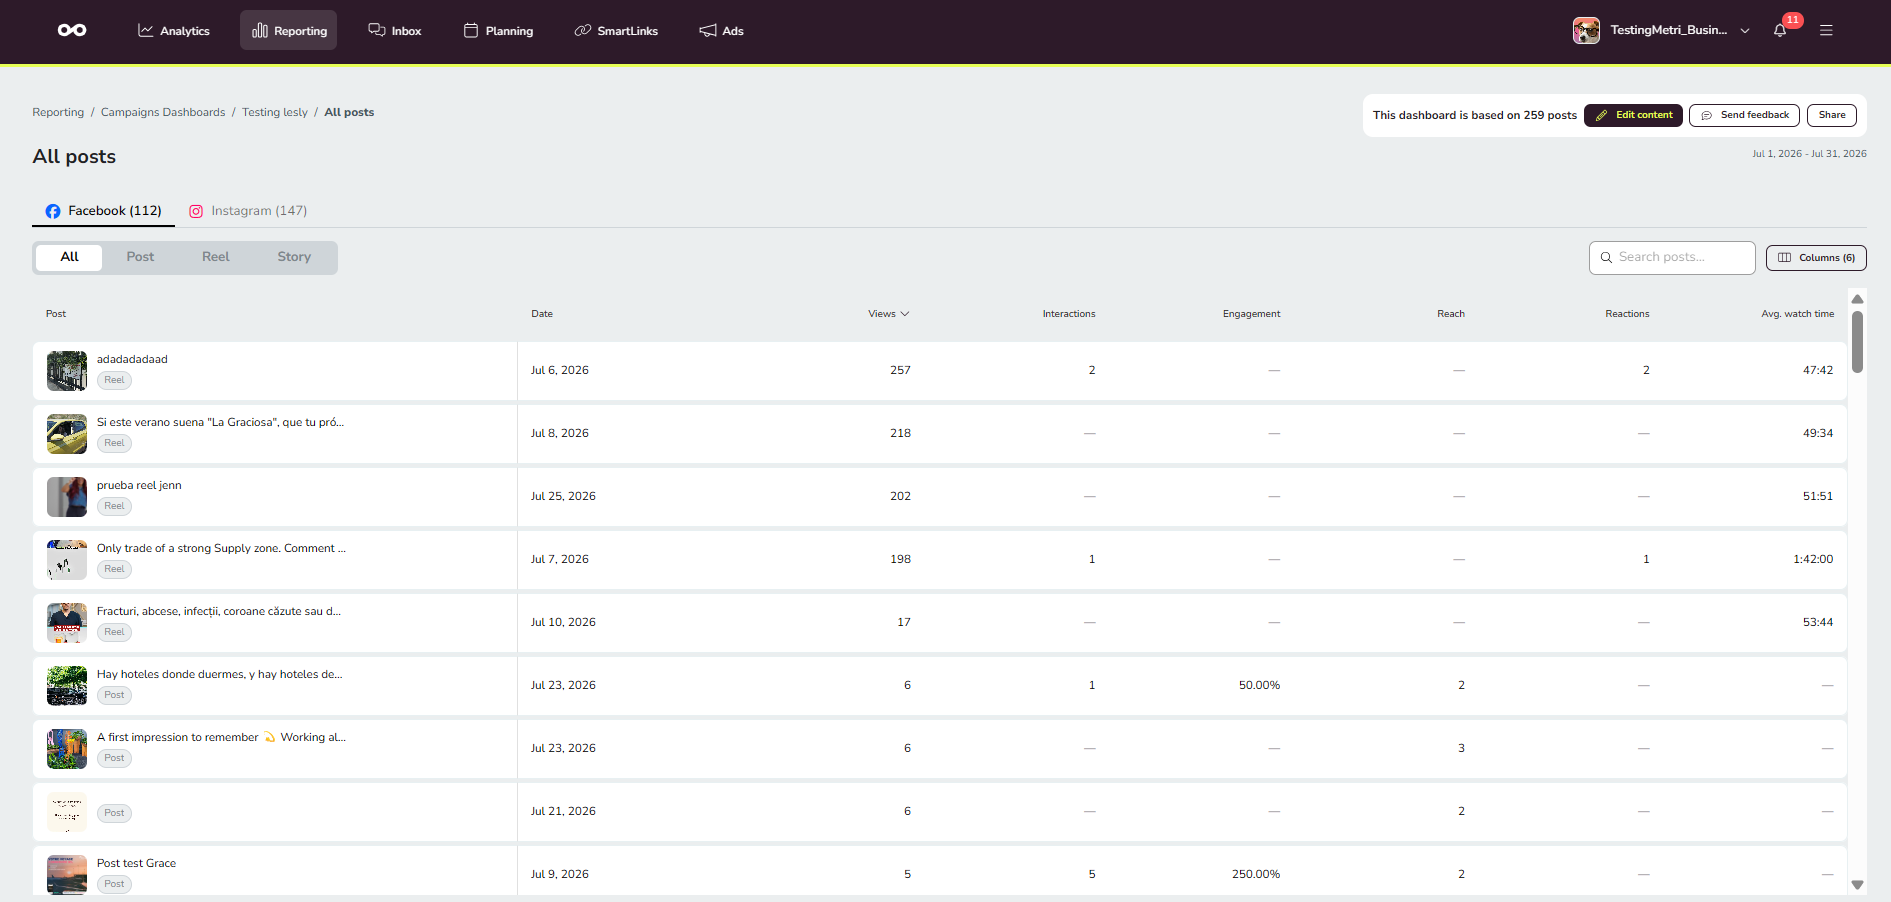
Navigate the list on three levels: tabs per network, a content-type filter inside each tab, and a Columns selector that chooses exactly which metrics are shown. Any column can sort the table.
Tabs per network — switch between the networks in the dashboard, for example Facebook and Instagram.
Content-type filter — inside each tab, filter by All, Post, Reel, or Story.
Columns — choose exactly which metrics are shown, including paid promotion metrics.
The same content tables also include content from the advertising networks — Google Ads, Meta Ads, and TikTok Ads — alongside the organic networks, each with its metrics. Your column selection is remembered per network and content type between sessions. The post column stays fixed while you scroll the table horizontally, and anyone with the public read-only link sees the same complete list.
Use Download CSV on the View posts sub-page to export the posts data currently shown in the list. You can also drag a column header to reorder the table, the same way column reordering works in Analytics: the order is independent of which columns you've shown or hidden with the Columns selector, and each network tab keeps its own column order.
AI Insights
Narrative insights generated automatically after each sync, covering:
Section | Content |
|---|---|
Executive summary | One narrative paragraph covering overall campaign performance |
Per-network cards | Performance, top post, detected pattern (when evidence is sufficient), recommendation |
Per-ads-platform cards | Investment efficiency, best result, improvement opportunity, recommendation |
Best posts cards | Common traits, dominant network/format, optional timing pattern, what to replicate |
Language: Determined from the campaign name and description. If those are inconclusive, Metricool uses the account owner's language.
Editing insights: Click any AI-generated insight text to enter edit mode. You can adjust the wording, add context, and insert emojis using the emoji picker. Changes are only saved when you click Save; click Cancel to discard them. The Regenerate button appears only in edit mode and is disabled with a tooltip if your dashboard has fewer than 10 posts. Empty states now clearly distinguish between insights being regenerated, not enough data, and deleted insights. If an error occurs during editing or regeneration, a notification appears with a retry option. Insights are based solely on your campaign's data. No comparisons to other campaigns or industry benchmarks. If you don't see AI Insights at all, make sure the dashboard has at least 10 posts and run a new sync. Per-network insights also require a minimum number of posts for that specific network.
Related articles
When you're ready to share results, read how to share your Campaign Dashboard.