
How comparison periods work in your metrics
Updated 2 months ago
Metricool explains how comparison periods are calculated and what percentage changes mean, so you can interpret your data accurately and understand trends in your social media performance.
Before diving in, it's important to know that the comparison logic is not the same in Analytics and in downloadable Reports:
In Analytics, the comparison always uses a period of equal duration (e.g., “Last 30 days” compares to the previous 30 days).
In Reports, when selecting a full month, the comparison is full month vs. previous full month, even if the months have different lengths.
With this distinction in mind, here’s how comparison periods work depending on your selection.
If percentages do not appear, it is because there is no equivalent previous period available for comparison. This usually happens with recent connections or when the selected date range is large and there is not enough historical data to generate the previous equivalent period.
Reports
Full Months
When selecting a full month from the dropdown, Metricool automatically compares it to the previous full month.
Example: A report for May (31 days) compares to April (30 days).
The automatic monthly summary always compares with the previous month.
Custom Ranges
When selecting a custom date range, Metricool compares it to the immediately previous range of equal duration.
Example: June 15 to July 14 (30 days) compares to May 16 to June 14 (30 days).
Analytics
Analytics filters (“Last 7 days”, “Last 30 days”, etc.) always compare with the exact previous days of the same duration.
This ensures equal-length comparisons in real time, while reports prioritize month-to-month comparisons.
Metrics in Analytics follow the date range you select. Choose the main period at the top right. Optionally use Create comparison view to build a comparison in Metricool Studio without changing the main period. This opens a new tab and creates a view in Metricool Studio based on your selection, without changing what you see in the main period. Metricool Studio builds the comparison automatically and saves it as a shareable view. See how to create comparison views from Analytics.

Comparison percentages under metrics use a previous period of equal duration.
Understanding Trends and Percentages
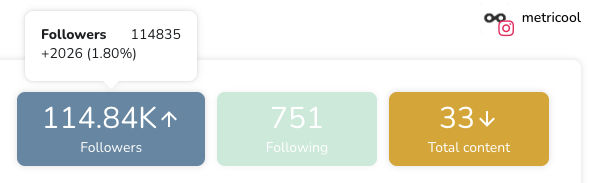
The arrows indicate whether your results have increased or decreased compared to the previous period.
Up arrow: growth
Down arrow: decrease
Hovering over a metric shows the exact breakdown:
Absolute value (e.g., +2026 followers)
Percentage (e.g., +1.80%)
This helps you quickly identify trends and understand how your performance evolved.
It is not possible to manually change the comparison period.
Advanced Custom Comparisons
For non-consecutive date comparisons (e.g., May 2024 vs. May 2023), use Metricool Studio or the Looker Studio Connector depending on your needs.
Metricool Studio
Metricool Studio is the native option. It does not require external setup, and you can create comparison views by writing a prompt or using the Create comparison view dropdown in Analytics. This opens Metricool Studio in a new tab and generates a view based on your selection, without changing the main period in Analytics. It handles non-consecutive periods, multi-brand comparisons, and multi-network data in a single view.
Example prompt:
Compare this February with last February for Brand A.Studio generates charts, tables, and written insights based on the prompt. The view is saved and can be shared or exported. For a full walkthrough, see What is Metricool Studio?
Looker Studio Connector
The Looker Studio Connector (Advanced and Custom plans) is an alternative if you need full manual control over dashboard design or want to combine Metricool data with external sources such as Google Analytics, BigQuery, or Google Sheets. See the Looker Studio Connector guide for setup steps.
With it, you can:
Compare your current range with the previous period (for example, last 30 days vs. previous 30 days).
Compare with the same period last year to detect seasonality.
Define a custom date range for both the current and comparison periods.
Apply it at the report, page, or chart level (e.g., scorecards, tables, or time series).
To learn how to configure these comparisons, see the official Looker Studio documentation.
Related Articles