
How to use and explore the Analytics tab
Updated 2 months ago
Use Analytics to explore performance for the selected brand: pick a network or Summary, set the main period, read metric cards, charts, and lists, and open a comparison view when you need a side-by-side period analysis.
Analytics is for day-to-day exploration. For downloadable PDFs, PPT files, or saved dashboards, use Reporting instead.
Open Analytics
Analytics is available in the top menu. Open it, then choose what to measure.
In the top menu, select Analytics.
In the social network selector (left sidebar), choose Summary for all connected networks, or choose one network (for example Instagram).
Select the main period
The Main period control at the top right sets the date range for every metric, chart, and table on the current Analytics view.
In the Analytics header, open Main period (calendar icon and date range).
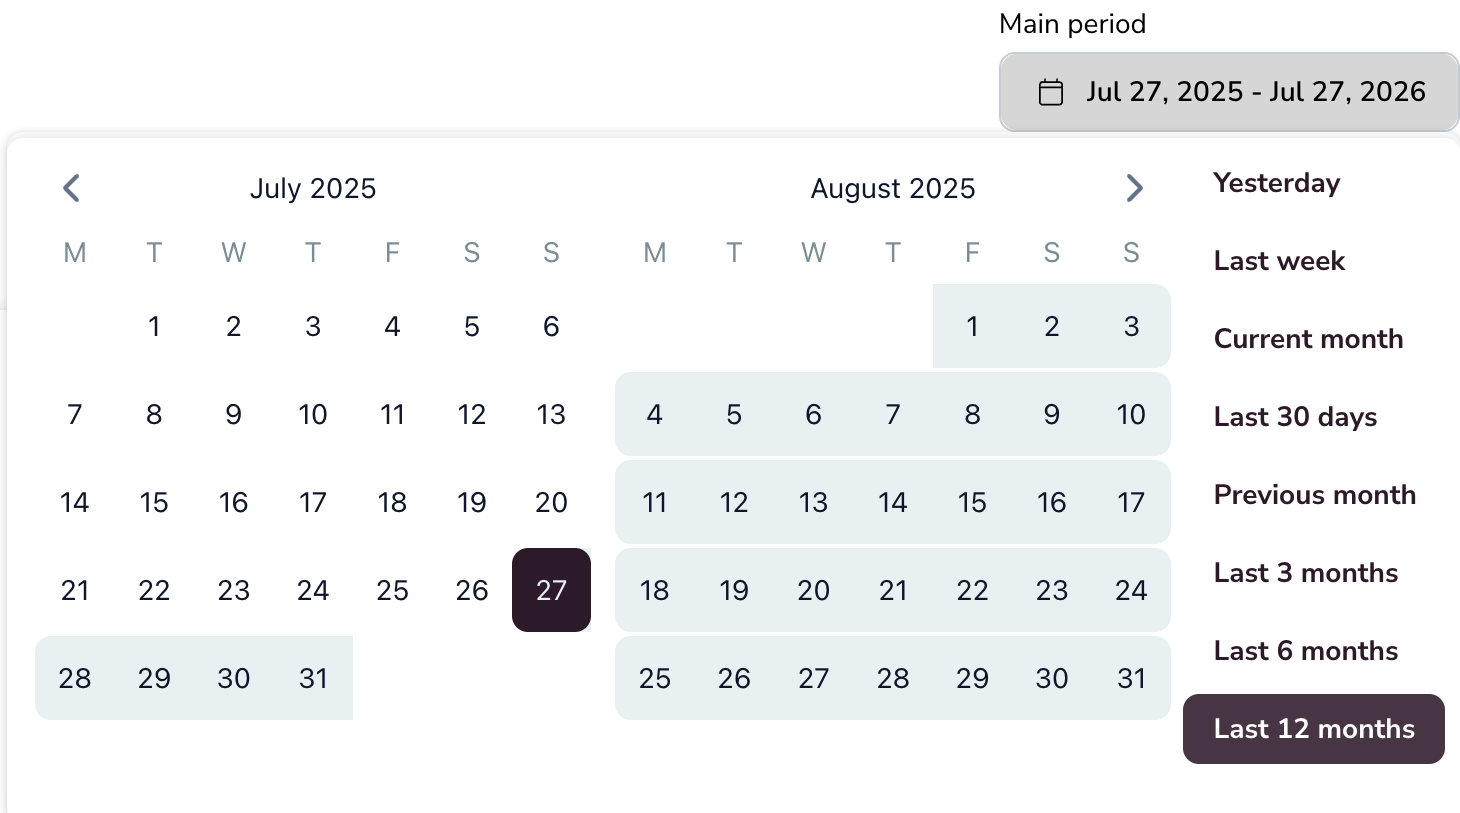
Choose a preset on the right of the picker, or set a custom range on the calendars.
Use a preset range
Select one of the presets in the picker:
Yesterday
Last week
Current month
Last 30 days
Previous month
Last 3 months
Last 6 months
Last 12 months
The selected preset highlights, and the main period field updates to that range.
Set a custom range
Pick any start and end date on the dual-month calendars.
Use the left and right arrows above the calendars to move to the month that contains your start date.
Click the start date on the calendar.
If the end date is in another month, use the arrows again to reach that month.
Click the end date. The range highlights between the two dates, and Main period shows the full range (for example Jul 27, 2025 - Jul 27, 2026).
All cards, charts, and tables on the page update to the selected main period. If a section has no data for that range, Metricool hides it.
Read comparison percentages
Under many metrics, Metricool shows how the main period changed versus the previous period of the same length.
Up arrow: the value increased versus the previous period.
Down arrow: the value decreased versus the previous period.
No percentage: there is not enough historical data for an equal previous period (common after a recent connection or with a very large date range).
Hover a metric to see the absolute change and percentage (for example +2026 and +1.80%). Analytics always compares equal-duration periods—for example, last 30 days versus the 30 days before that. You cannot manually change the comparison period in Analytics.
For the full rules, including how Reports differ, see How comparison periods work in your metrics.
Create a comparison view

Use Create comparison view when you want a saved side-by-side analysis in Metricool Studio without changing the main period in Analytics. The control is visible in the Analytics header.
In the Analytics header, click Create comparison view to open the dropdown.
Select Previous week, Previous month, or Custom range.
Metricool Studio opens in a new tab, builds the comparison from your selection, and saves it to your view list.
Your Analytics main period stays as it is. Full steps are in How to create a view in Metricool Studio.
Work with metric cards and charts
Most Analytics sections pair summary cards with a time-series chart for the same metrics.
Metric and result cards
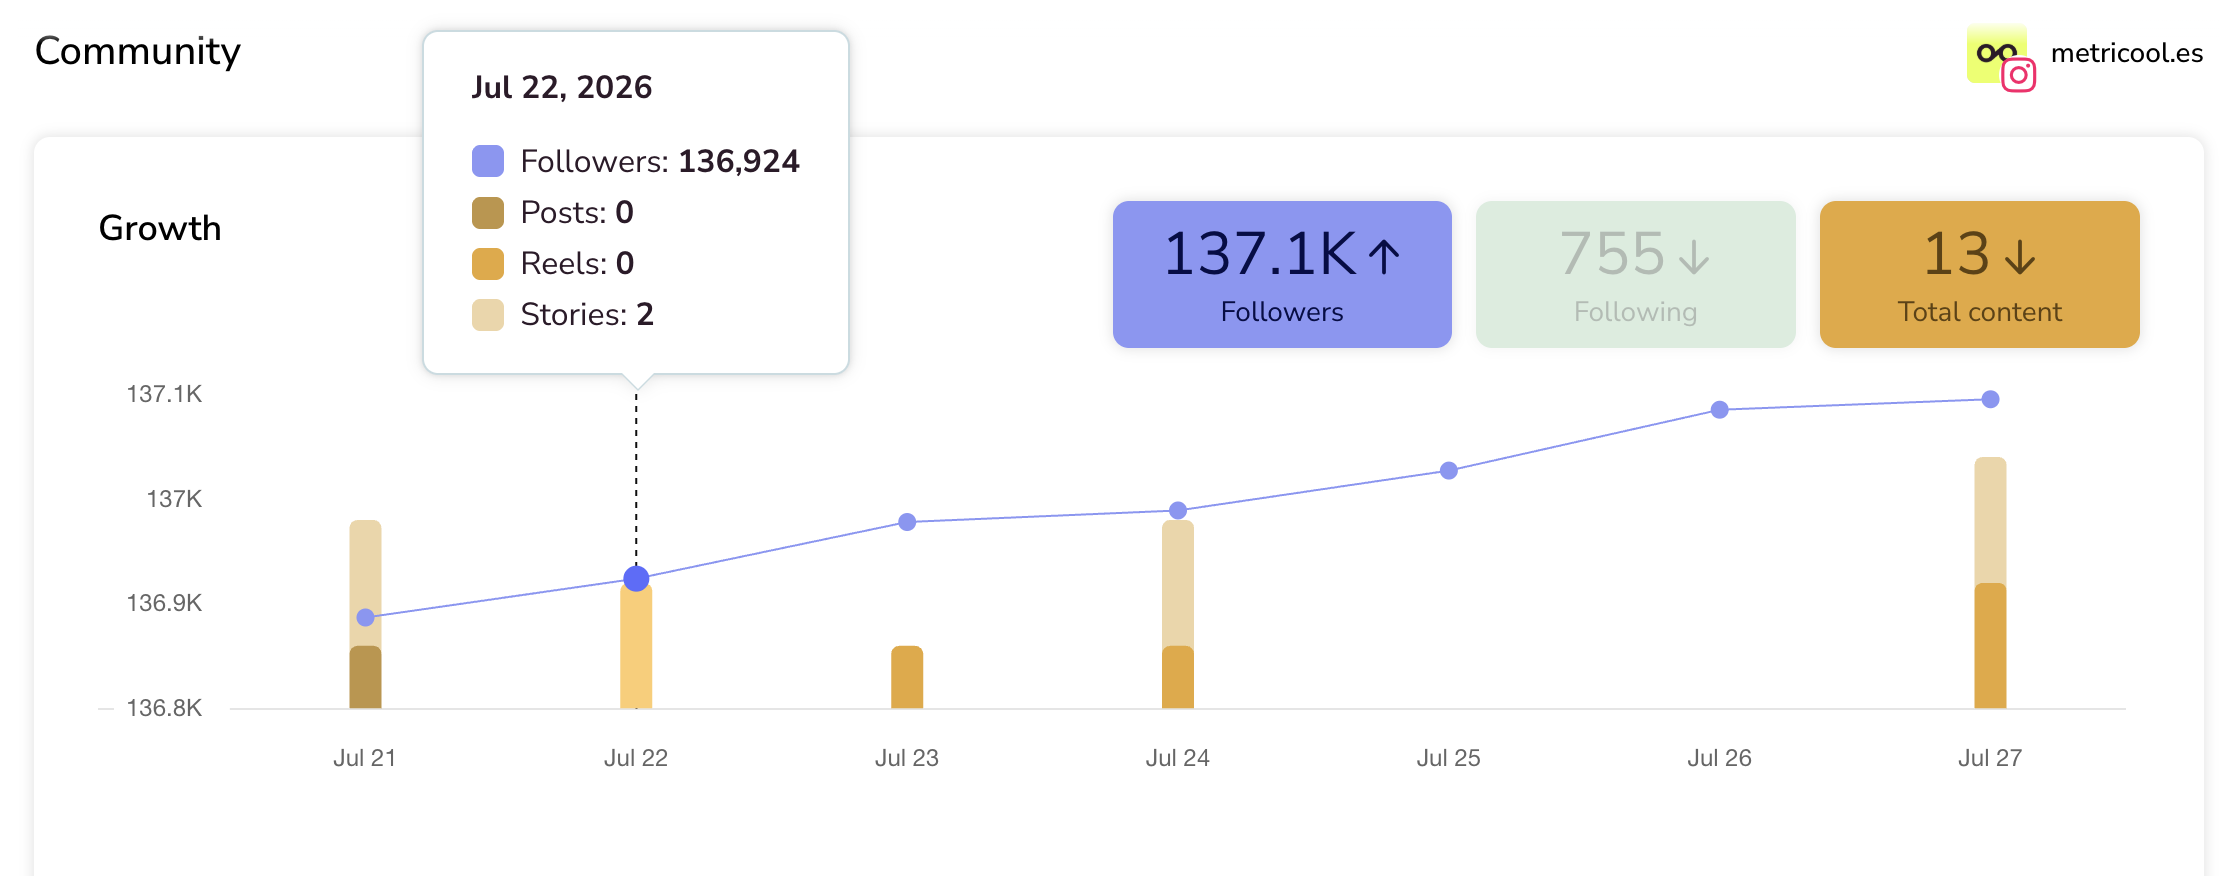
Cards show totals (or category totals) for the main period, often with a comparison arrow. On Summary, network cards also show each network’s share of the total and whether it went up or down.
Click a result card to include or hide that series in the chart. Hiding a card only changes the chart display; it does not delete data or change the underlying metrics.
Switch between chart and table
Some metric blocks can show the same data as a chart or as a table. Use the control on the block to switch to the view that is not currently shown.
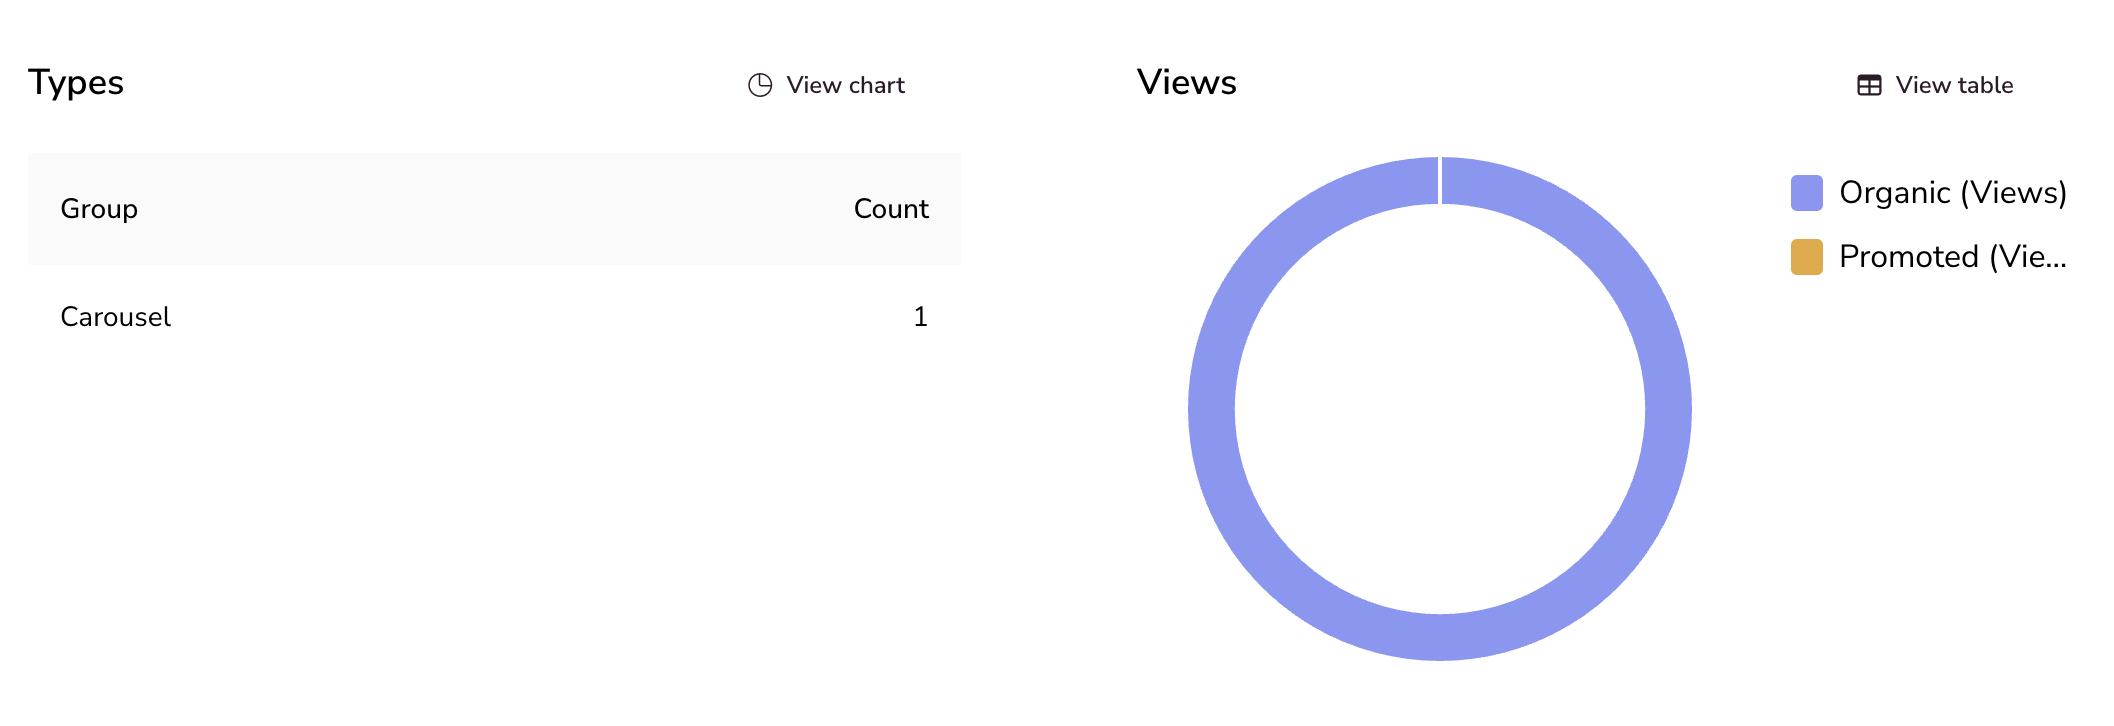
Click View table when the chart is showing to open the table view.
Click View chart when the table is showing to open the chart view.
Chart hover
Hover any point on a chart to see:
The date for that point
Metric values for that day
Breakdown values, when a breakdown is applied
Metrics with breakdown
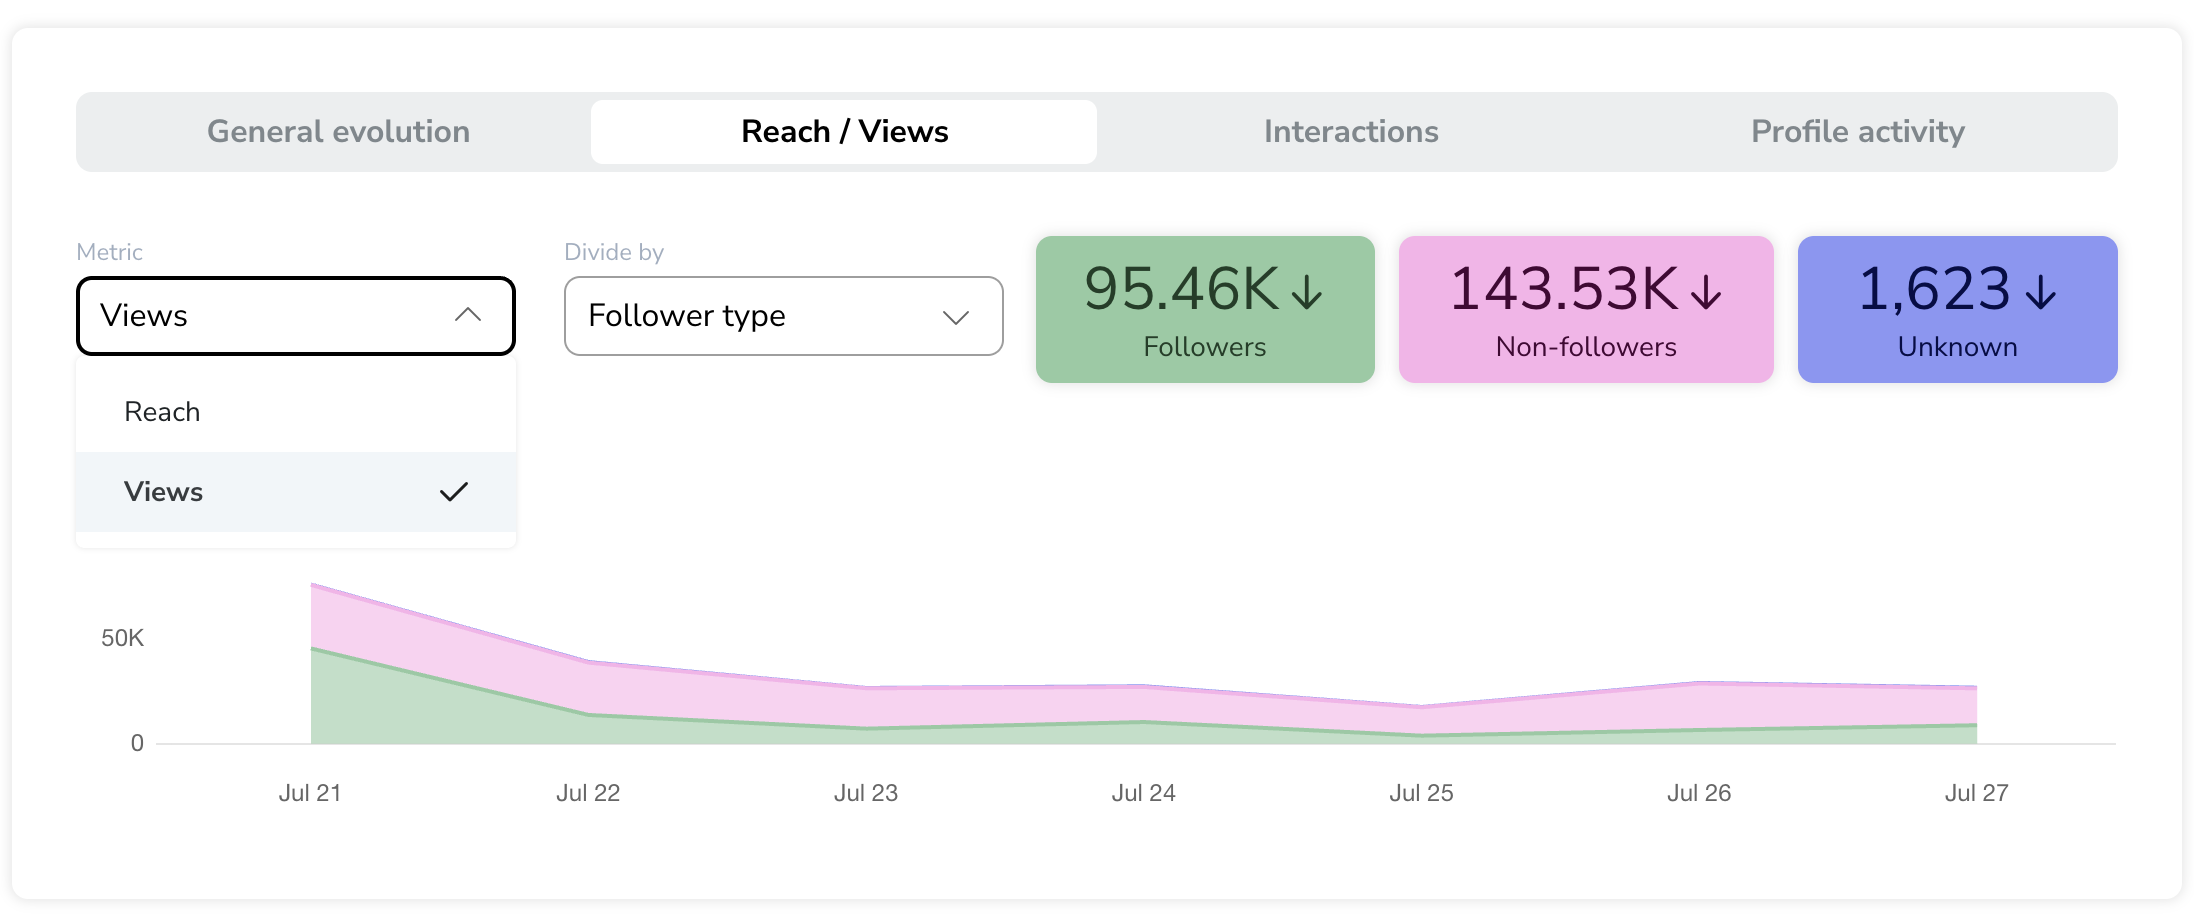
On Instagram Account analytics, some metrics support breakdowns. Use Metric and Divide by to split a total into categories—for example reach by follower type or interactions by content type—for a more detailed view. Breakdowns are currently available only for Instagram. Full controls and category lists are in Instagram Account metrics: breakdowns and charts.
Work with lists
Analytics includes lists such as posts, campaigns, and hashtags on Instagram. List tools apply to the main period. Which options appear depends on the list.

List controls
Use the toolbar and column headers to find, shape, export, and sort the list.
Use Search to find rows when the list includes search.
Use Columns to show or hide table fields and available metrics.
Use Download CSV to export the list.
On a post list, click a column header to sort by that field in ascending or descending order. The arrow on the header shows which field is active and the sort direction.
Drag a column header to move that column anywhere in the table; a drag handle appears on hover, and an insertion line shows where the column will land. Your order is remembered per brand and per table, Reset order in the Columns menu restores the default, and reordering works on web only — the saved order stays in your browser and does not sync across devices.
Add to dashboard
On post and campaign lists, use Add to dashboard to add selected items to one or more Campaign Dashboards.
Select each row with its checkbox, or use the checkbox in the header to select all rows in the current view.
Click Add to dashboard.
Full steps are in How to create a Campaign Dashboard and add content.
Post row actions and Detailed analytics
On a post row, use the row controls for quick actions and deeper analysis.

Open the three-dots menu for Copy to clipboard, Reuse content, and Watch the original.
On supported networks, open Detailed analytics to review the post’s day-by-day evolution after publishing. Detailed evolution is available for Instagram posts and Reels, TikTok posts, and LinkedIn posts. Full steps, plan requirements, and metrics are in How to see the detailed evolution of your posts (up to their first 30 days).
Move through list pages
Long lists use pagination at the bottom of the table.

Use Items per page to choose how many rows each page shows.
The range (for example 1-4 of 4) shows which rows are on the current page and the total count.
Use the page controls to go to the first page, previous page, next page, or last page.
Explore insights from analytics tables
Explore insights runs Metricool Studio AI analysis directly on the table you are looking at, with no need to open Metricool Studio's creation modes. The shortcut sits at the top of analytics tables such as the list of posts.
In Analytics, open the table you want to analyze, for example the list of posts for a network.
Click Explore insights at the top of the table. An inline panel opens with ready-made questions: which content performed best, which performed worst, what patterns repeat in your top content, which format drives more engagement, what you should publish more of, and what changed versus the previous period.
Pick a question. Metricool Studio generates the answer view and opens it in a new tab, reusing the existing Metricool Studio generate view flow.
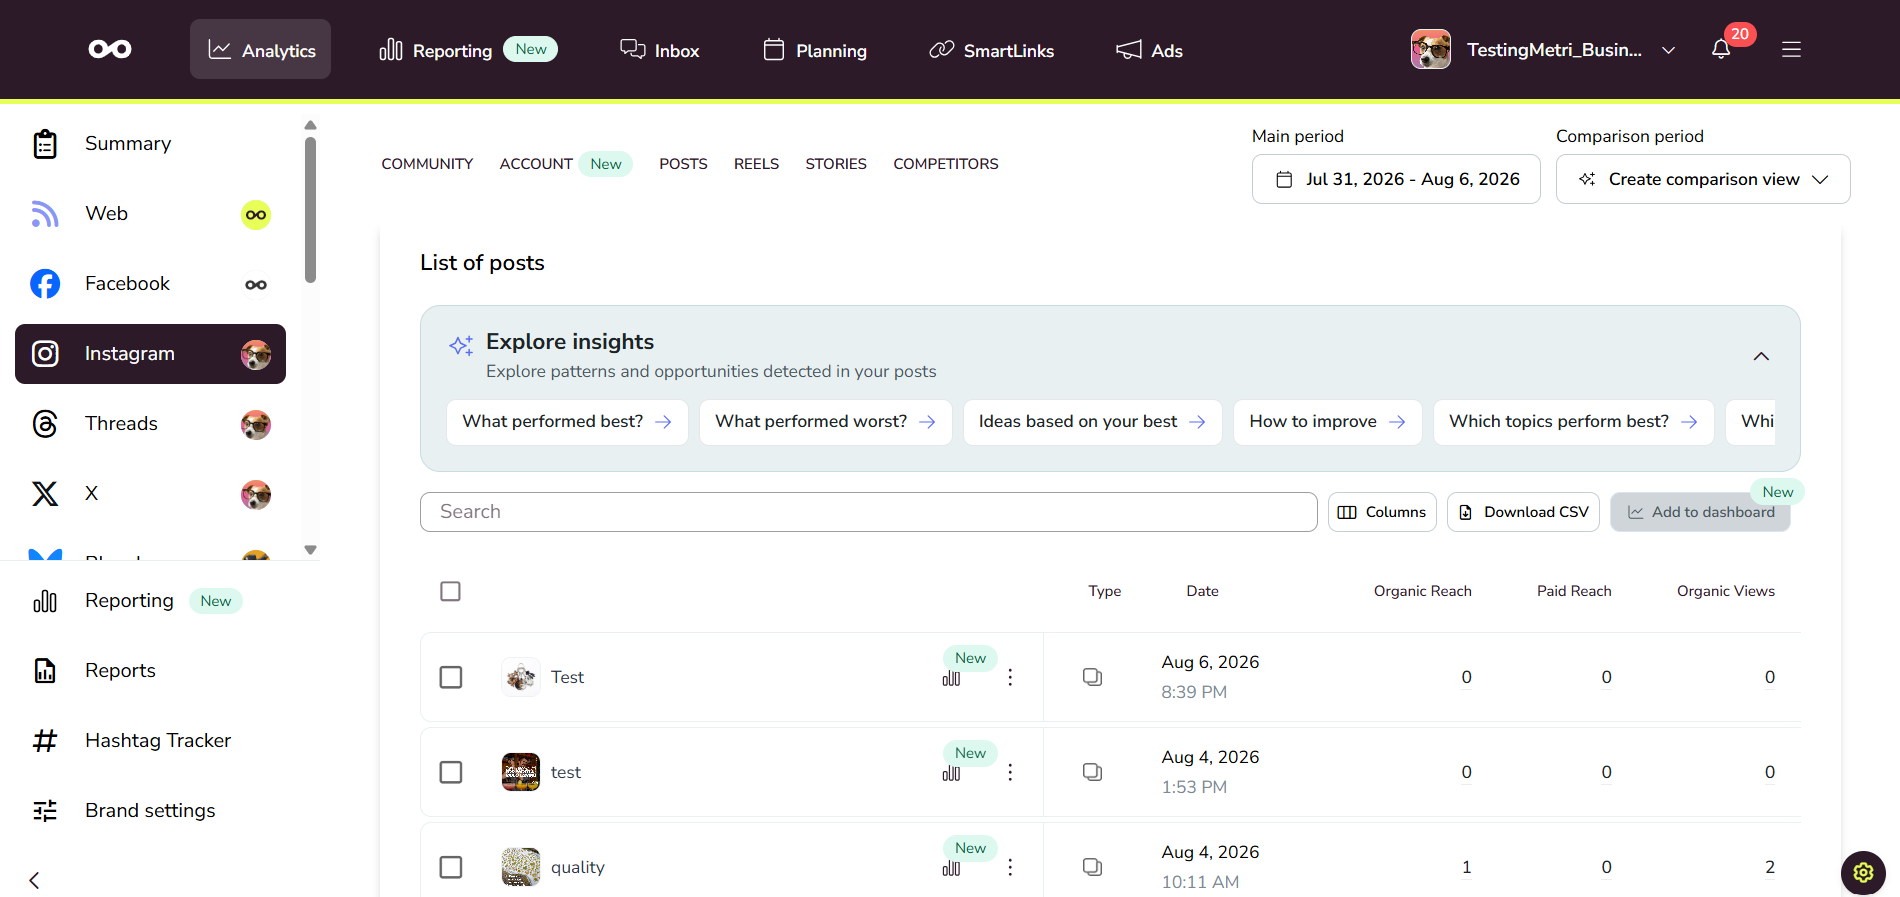
Explore insights uses the same plan permissions as Metricool Studio, so there is nothing new to enable. Plan availability and access rules are the same as for Studio — see What is Metricool Studio?.
Read the answer view
The answer view opens with the AI analysis as charts, tables, and written insights. When the question ranks your content, the view uses the new top content component: cards for your best performing pieces, each with the post thumbnail, title, and key metrics — engagement, views, reach, and saves — so the ranking is readable at a glance.
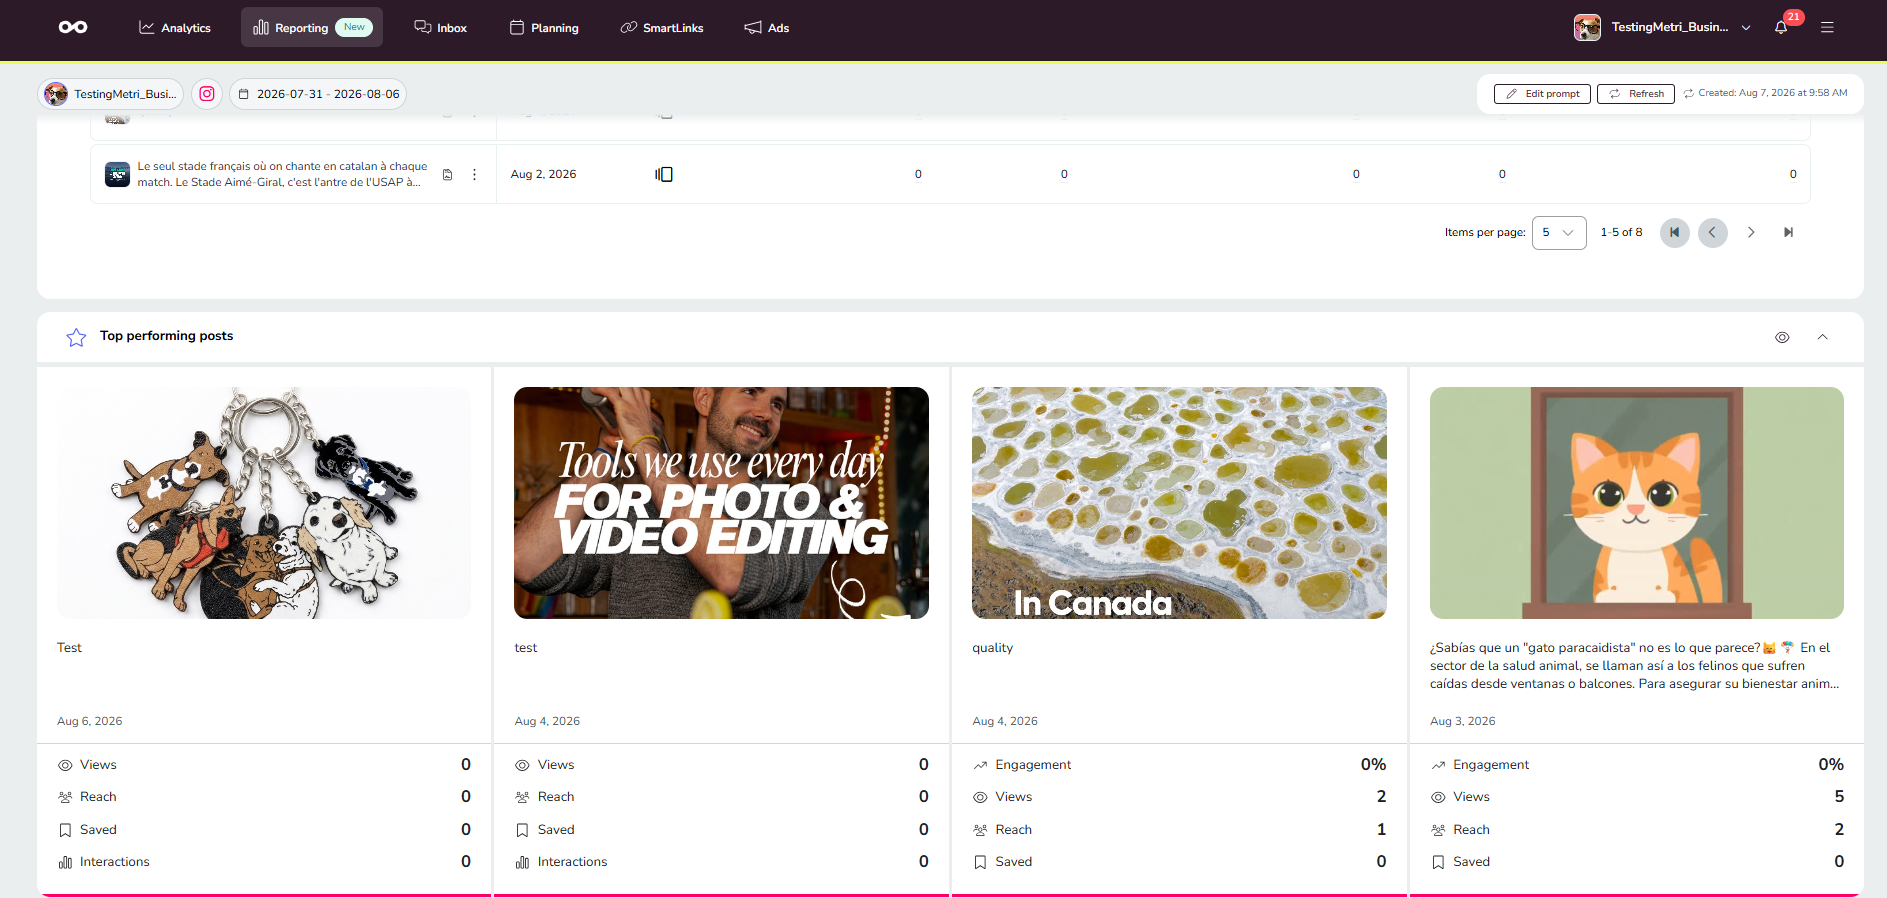
The top content cards are only available through Explore insights. They do not appear in Step by step or Prompt from scratch views, nor in custom views and versions.
What to open next
After you can move around Analytics, go deeper by topic:
Instagram Account metrics: breakdowns and charts — metrics with breakdown on Instagram Account
Your metrics in Metricool: full guide — metric definitions and which networks support organic and paid data
How comparison periods work in your metrics — Analytics vs Reports comparison rules
How to generate Reports — PDF and PPT exports when you need a deliverable
Related articles