
Summary Metrics
Updated 2 months ago
Summary aggregates metrics from every social network connected to your brand. You see totals across networks plus a per-network breakdown ordered from highest to lowest.
Use Summary for a cross-network overview. For metric definitions and charts specific to one network, open that network’s metrics article.
It is not possible to display metrics older than the last 30 days on YouTube.
Open Summary
In Analytics, select Summary in the social network selector. Choose the main period at the top right. Optionally use Create comparison view to build a comparison in Metricool Studio without changing the main period.
Summary has three tabs: Account, Posts, and Ad accounts.
Comparison percentages under metrics use a previous period of equal duration. For how that calculation works, see How comparison periods work in your metrics.
Account
The Account tab shows audience size across your connected networks.
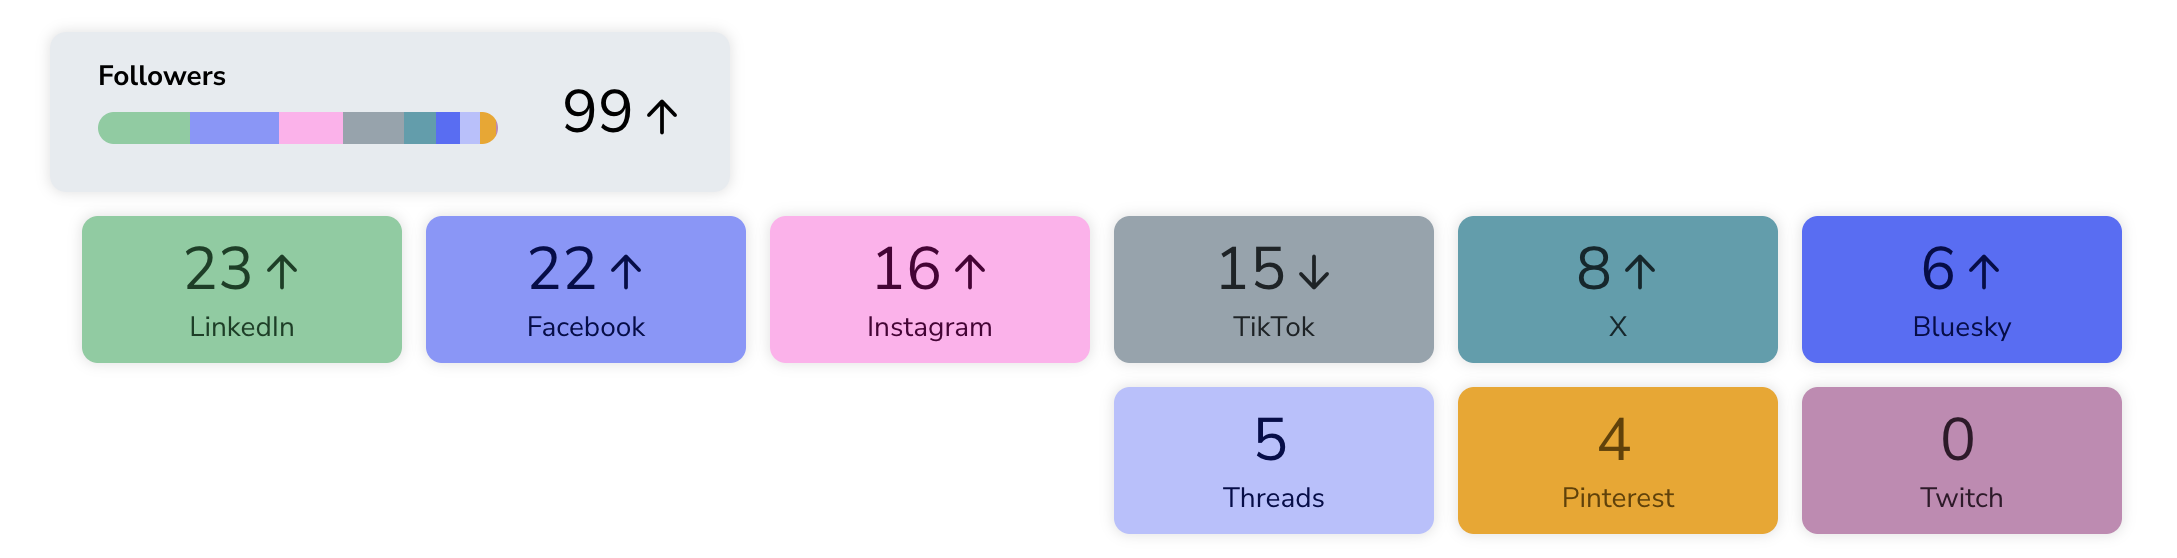
Followers: total followers (or subscribers, when that is the network metric) for the selected period, with a per-network breakdown and a time-series chart.
Each network card shows its share of the total and whether the value went up or down versus the comparison period.
Posts
The Posts tab summarizes organic publishing activity and engagement across networks.
Interactions
Total interactions across all connected networks for the selected period, with a per-network breakdown and a time-series chart.
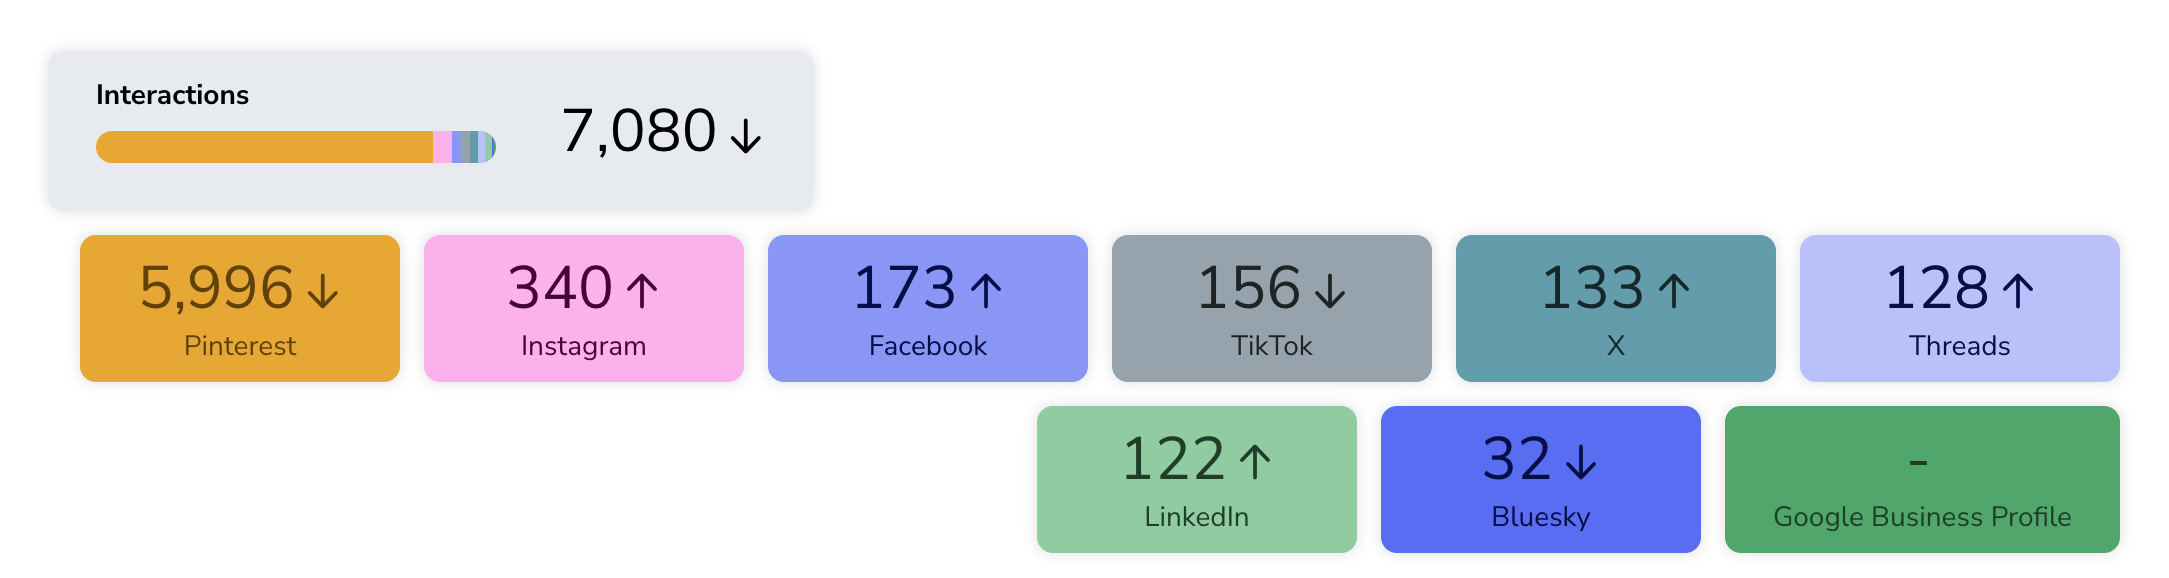
On Instagram and Facebook, posts and interactions include posts, Reels, and Stories.
Number of posts
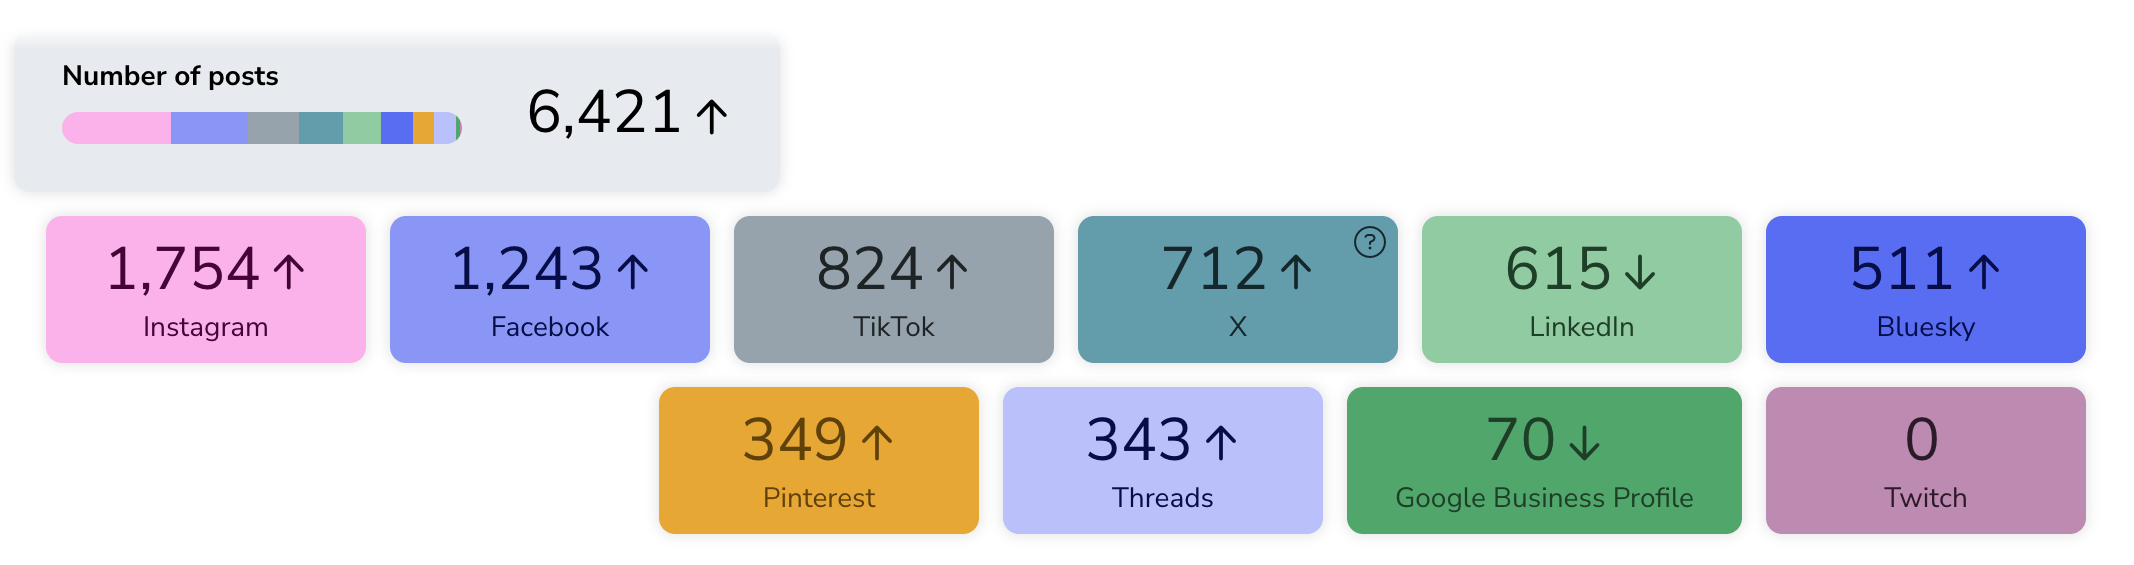
Total posts published in the selected period, with a per-network breakdown and a time-series chart.
List of posts
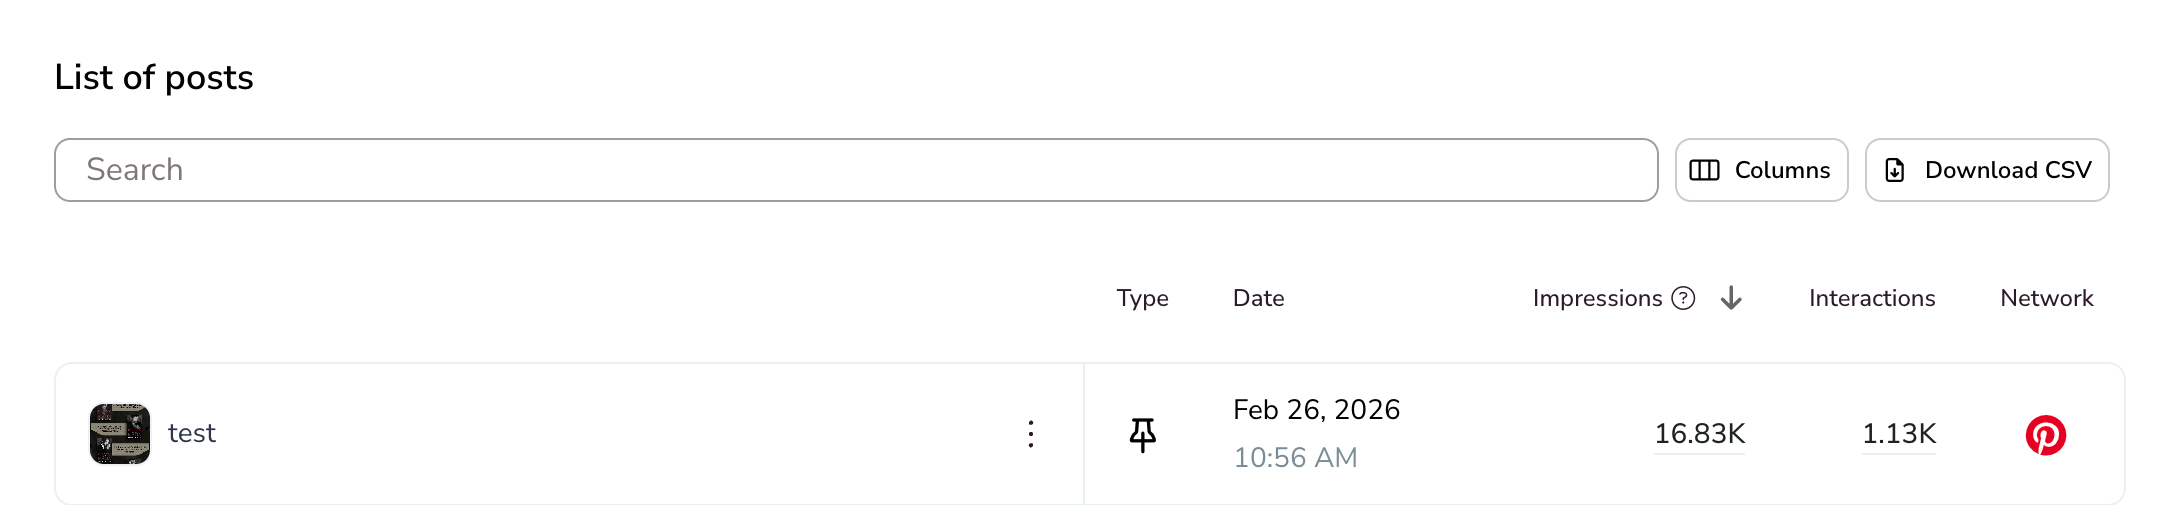
A searchable table of posts from your connected networks in the selected period. You can adjust visible columns and download the table as CSV.
Type: content type of the post
Date: publication date and time
Impressions: how many times the post was displayed
Interactions: engagement actions on the post
Network: the social network where it was published
Ad accounts
The Ad accounts tab aggregates paid metrics from the ad accounts connected to the brand: Meta Ads, Google Ads, and TikTok Ads.
Impressions: how many times ads were displayed
Clicks: how many times ads were clicked
Performance (CPM): cost per thousand impressions
Performance (CPC): cost per click
Spent: total ad spend in the selected period
Each metric shows a total plus cards for Meta Ads, Google Ads, and TikTok Ads, with a time-series chart. At the bottom of the tab you can search the table, choose columns, and download CSV.
Metrics by social network
For definitions and charts specific to one network or ad platform, open its metrics article:
Related articles