
Advanced analytics data is not retroactive. Day-by-day collection starts when your account gains access to the feature. If you activate the add-on now, on posts that were already published you'll only see the days from activation onward; earlier days appear empty. If you were already on an Advanced plan, your first 15 days were saved and will now be completed up to day 30.
Advanced analytics: see the detailed evolution of your posts (up to their first 30 days)
Updated last month
Advanced analytics shows the day-by-day evolution of the metrics each post already has, counting from the day it was published. The availability of Advanced analytics is as follows:
Advanced plan or higher: shows 15 days by default, or you can extend it to 30 days by adding the Advanced Analytics add-on.
Starter plan: only available with the Advanced Analytics add-on, which gives you the full 30 days.
Not available on the Free plan or in the mobile app.
Content behavior on social media has changed: posts are no longer short-lived pieces that only perform in their first hours. They can continue growing days later, and it is during the first 15 days (or 30 days with the Advanced Analytics add-on) that most of their performance is defined.
That's why analyzing daily or cumulative evolution is important: it helps you understand what type of content works and use those insights to optimize your future posts.
Availability by social network
Advanced analytics is available only on the web version (not the mobile app), and only on the social networks listed below. Networks that aren't listed don't have this feature.
Social network | Content type | Data availability |
|---|---|---|
Posts and Reels | Since November 1, 2025 | |
TikTok | Posts | Since December 23, 2025 |
Posts and newsletters | Since February 17, 2026 |
Advanced analytics data is organic and available from the dates indicated. On Advanced plans or higher you get 15 days by default, or 30 days with the Advanced Analytics add-on. On Starter plans it's only available with the add-on, with 30 days. Not available on the Free plan.
What can you see in this analysis?
The advanced analytics view lets you see how the performance of each post changes from the day it is published.
You can:
Analyze the evolution of your posts during their first 15 days on Advanced or higher plans, or 30 days with the Advanced Analytics add-on (Starter plans included).
Identify which content performs better based on real behavior.
Review key metrics such as organic views per day or interactions per day.
View charts that help you detect peaks, drops or patterns.
Choose how you want to view your advanced analytics:
▪️ Cumulative, to see total growth.
▪️ Daily, to analyze performance for each specific date.
How to access the detailed analysis
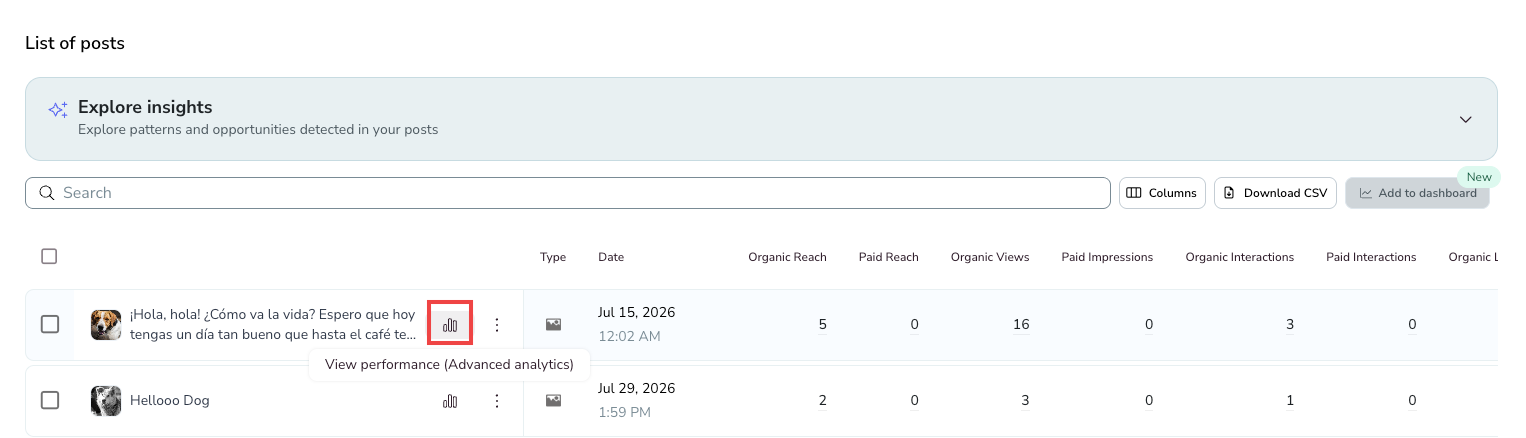
Advanced analytics is only available on the web version. In the app, the button is labeled "Advanced analytics" (the chart icon that appears when you hover over a post in the Analytics list).
Go to Analytics for the social network you want to review.
In the corresponding section, scroll down to the List.
Hover over the post you want to review and click the chart button (labeled "Advanced analytics") to open its day-by-day evolution.
How to interpret the data
The charts show two complementary views:
Daily view: Shows the specific performance for each day. Ideal for identifying when a post had an interaction spike or when it stopped growing.
Cumulative view: Shows total growth from the publication date. Useful for understanding the overall trend and comparing total performance between posts.
Compare similar posts to identify patterns. If one Reel keeps growing after day 7 while another stops at day 3, you can analyze the differences (topic, format, posting time) to replicate the success.
Available metrics
All metrics are organic reach and don't include advertising. The metrics you can analyze depend on the network and content type.
Metric | Instagram (posts & Reels) | TikTok (posts) | LinkedIn (posts & newsletters) |
|---|---|---|---|
Views | ✓ | ✓ | — |
Interactions | ✓ | ✓ | ✓ |
Reach | — | ✓ | — |
Impressions | — | — | ✓ |
Likes | ✓ | ✓ | — |
Comments | ✓ | ✓ | ✓ |
Saves | ✓ | — | — |
Shares | ✓ | ✓ | ✓ |
Reactions | — | — | ✓ |
Clicks | — | — | ✓* |
*Clicks is only available on LinkedIn company pages. LinkedIn doesn't provide this data for personal profiles.
Available metrics may vary depending on the social network. Check the guide Your metrics in Metricool to see the full definition of each metric by social network.
FAQs
Why do some of my posts show empty days?
Why doesn't the chart button appear on some of my posts?
There's a minimum date per network before which no data exists. There's no data for posts published before November 1, 2025 on Instagram, December 23, 2025 on TikTok, or February 17, 2026 on LinkedIn. For posts published before these dates, Advanced analytics isn't available.
Why can I only see 15 days of evolution?
Advanced plans or higher show 15 days by default. To extend the window to 30 days, add the Advanced Analytics add-on. On Starter plans, the feature is only available with the add-on, which gives you the full 30 days.
Saves and shares are strong indicators that your content provides value. Pay special attention to posts with high values in these metrics.
Was this helpful?
Was this helpful?