
Instagram groups some data without classification.
Instagram Account metrics: breakdowns and charts
The Account section in Instagram analytics shows aggregated performance data for your account within the selected date range, including breakdowns that identify where activity comes from.
If you are looking for the full list of Instagram analytics available in Metricool, see Instagram Metrics.
Where to find Account metrics
Go to Analytics
Select Instagram from the left sidebar
Open the Account section
Inside Account, Metricool currently shows these subtabs:
General evolution
Reach / Views
Interactions
Profile activity
When to use Account metrics
Use the Account section to review overall Instagram performance before accessing post-, reel-, or story-level analytics.
It helps you identify visibility trends, compare activity by content type, and review audience origin based on available breakdowns.
Chart behavior and comparison
All charts in the Account section share the same interaction behavior.
When hovering over any chart:
Displays:
→ Date
→ Metric values for that day
→ Breakdown values (if applied)Comparison with previous period:
→ Displayed only when data is available
For more details, see How comparison periods work in your metrics.
Below, you can find the details for each subtab.
General evolution
This subtab shows a summary of account-level metrics for the selected period.
Use this section to review overall account performance for the selected period in a single view.
Available metrics
Views → Total views recorded during the selected period
Avg. reach per day → Average daily reach
Accounts engaged → Total engaged accounts
Total content → Total number of posts, reels, and stories
Chart behavior
Metrics are displayed over time
Visualization format:
→ Views, Avg. reach per day, Accounts engaged → line chart
→ Total content → bar chart
Instagram has replaced Impressions with Views on accounts, posts, and reels. For background on this change, see Instagram replaces “Impressions” with “Views”: What you need to know.
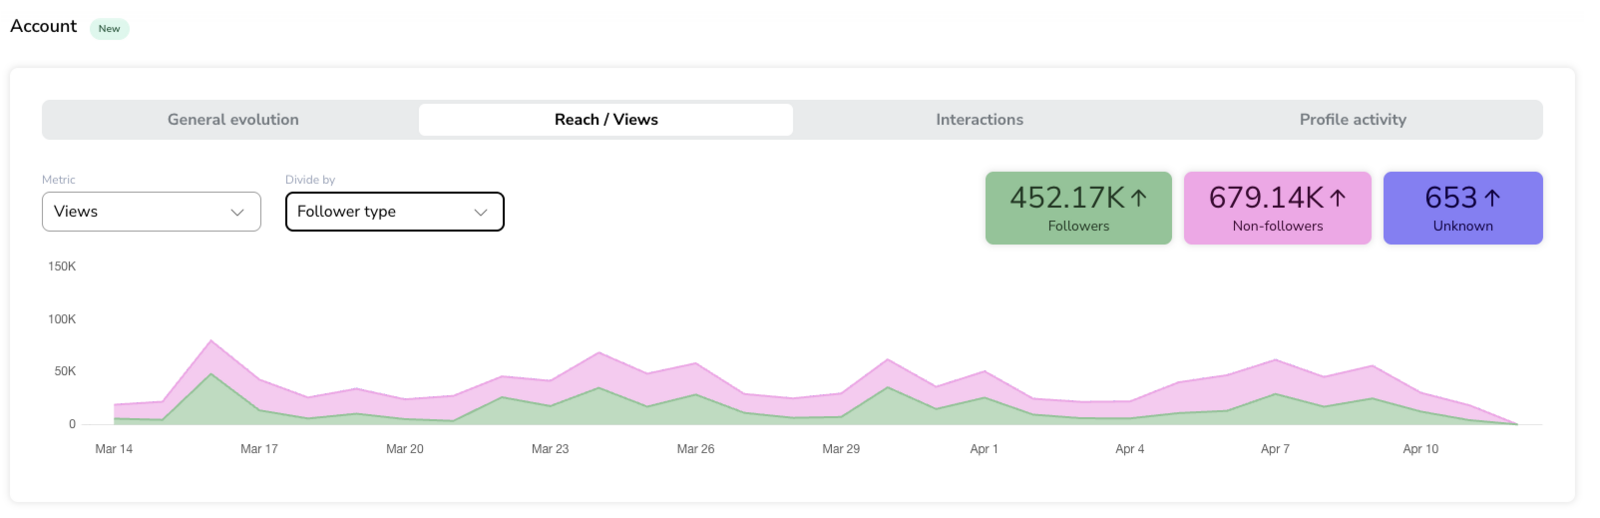
Reach / Views
This subtab displays account visibility metrics using breakdowns provided by Instagram.
Use this section to identify where your account visibility comes from based on available breakdowns.
Available controls
Metric selector:
→ Reach
→ ViewsBreakdown selector (Divide by):
→ Follower type
→ Content type
When you divide Reach by Follower type, the values shown are average values for each category (Followers, Non-followers, Unknown).
Follower type breakdown
Followers → Activity from users who follow the account
Non-followers → Activity from users who do not follow the account
Unknown → Data grouped by Instagram without classification
Content type breakdown
Posts
Reels
Stories
Carousel
Ads
Data visualization
Chart:
→ Displays selected metric over time
→ Data is stacked by categorySummary cards:
→ Total values per category for the selected period
How data is calculated
Reach is provided daily by Instagram (Meta's API), deduplicated within each individual day — meaning each person is counted only once per day, even if they saw the content more than once that day.
The value shown in each card (whether broken down by Content type or Follower type) is the average of that daily unique reach across the selected date range — it is not a cumulative total for the whole period. For example, if a card shows "500" for Reels, this means an average of 500 unique people were reached by Reels per day during the selected period, not that 500 unique people in total were reached across the whole period.
We show this average instead of a cumulative total because simply adding up each day's unique reach would count the same person more than once if they were reached on several different days within the period — distorting the "unique" nature of reach. Averaging the daily values instead gives a more accurate, realistic picture of your account's day-to-day visibility.
This calculation applies equally to both breakdowns (Content type and Follower type) — there is no difference in how they are calculated.
This average-per-day figure is different from "Average reach/post" or "Average reach/reel", shown in the Posts and Reels sections, which is the average reach per publication (total reach of all posts/reels divided by the number of posts/reels published), not per day. Because these two metrics use different denominators (days vs. number of publications), they are expected to differ and should not be compared directly. See Instagram Metrics for details on how those are calculated.
Views are provided by Instagram
Each value is assigned based on Instagram classification
When hovering over a specific date in the chart, the values shown (and their total) correspond to that individual day only — not the average for the entire selected period. Since the summary cards show an average, some individual days will naturally be higher than that average and others lower; this is expected and does not indicate an error.
Notes and limitations
Breakdown availability depends on Instagram API
Categories such as Unknown are defined by Instagram
Content classification depends on Instagram
Metricool does not reclassify content
Interactions
This subtab shows interaction metrics grouped by content type.
Use this section to compare how different content types contribute to interactions during the selected period.
Available controls
Metric selector:
→ Total interactions
→ Comments
→ Likes
→ Saved
→ SharedBreakdown selector (Divide by):
→ Content type
Content type breakdown
Story
Reels
Feed
Ad
Data visualization
Summary cards:
→ Total interactions per content typeChart:
→ Displays selected metric over time
→ Each content type is shown as a line
How data is calculated
Interaction metrics are provided by Instagram
Values are aggregated for the selected date range
Each interaction is assigned to a content type
Profile activity
The Profile activity subtab shows actions performed on your Instagram profile during the selected date range.
Use this section to review how users interact with your profile buttons and contact options.
Available controls
Metric selector:
→ Profile clicksBreakdown selector:
→ Button type
Button type breakdown
Book now
Call
Get directions
Email
Text message
Experience
Data visualization
Summary cards:
→ Total clicks per button typeChart:
→ Displays clicks over time
→ Segmented by button type
How data is calculated
Based on clicks on profile buttons provided by Instagram
Aggregated for the selected date range
Notes and limitations for Profile activity
Data depends on Instagram API and profile configuration
Only active buttons with data are displayed
Some interactions may not be classified
FAQs
Why do I see “Unknown” in follower type?
Why don’t I see the Content type breakdown?
It depends on Instagram API availability.
Why do my metrics differ from Instagram?
Differences may occur due to data refresh and aggregation.
Why don’t I see all interaction or button types?
Only categories with available data are displayed.
Why is Reach for Reels shown differently in the Account section vs. the Reels section?
The Account section shows the average daily unique reach that Meta reports for that content type across the selected period. The Reels section instead shows the average reach per Reel published (total reach of all Reels divided by the number of Reels). Since one is averaged per day and the other per publication, the two figures use different denominators and are not meant to match.
Why do the numbers I see when hovering over a specific day differ from the summary cards?
The summary card shows the average daily reach across your entire selected period, while hovering over a specific date shows that day's own value instead. Since it's an average, some individual days will be above it and some below — for example, seeing a higher number on a specific day than the period average shown in the summary card is expected, not an error.
Was this helpful?