
LinkedIn company page metrics
Updated last month
LinkedIn data is organic. Only the paid followers metric refers to paid data and is displayed only if there’s data for the selected period.
Good to know
Reposts: Metricool can only show analytics for original content published by your page. Reposts of third-party posts do not include metrics for your page because of a LinkedIn API limitation: the impressions and interactions belong to the original publication, so there is no data we can retrieve.
Newsletters (formerly Stories): As of July 28, 2025, the Stories section has been renamed Newsletters to reflect the change in the type of content displayed there.
API vs LinkedIn interface: Some LinkedIn metrics may not match the values shown in the LinkedIn interface. Metricool retrieves this data directly from the official LinkedIn API. According to their documentation, the metrics
IMPRESSION,MEMBERS_REACHED,RESHARE,REACTION, andCOMMENTare not consistent with the user interface at the moment.
For date ranges, comparisons, charts, and CSV exports, see How to use and explore the Analytics tab.
If you hover over the arrow icon next to the numbers, it will show you the variation of the current period with respect to the previous period. For example, if you select a week, the result will compare to the previous 7 days.
Community
✅ GROWTH
Followers: Total number of followers of the company page at the end of the selected period.
Posts: Number of posts published in the selected period.
Followers: Growth of followers in the selected period (difference between the last selected day and the day before the first selected day).
Daily followers: Average number of followers gained or lost in the analyzed period.
Followers per post, Posts per day, Posts per week: average between the total data and the selected time range.
✅ BALANCE OF FOLLOWERS
LinkedIn company pages show the Net Follower Change: a single number for the difference between your follower count at the end of the period and the day before it started.
See How the Follower Balance works across social networks for more details.
Account
✅ CONTENT VIEWED IN PERIOD
Displays the total performance of your content (posts and newsletters) during the selected period. It also includes the interactions or impressions that this content received within those dates, even if it was published earlier.
Impressions: Total number of times your content was displayed during the selected period. Note that this may include impressions from content published before the selected date range, as long as it generated impressions within that timeframe.
Reactions: Total number of reactions (like, interesting, etc.) received by your content during the selected period. May include reactions to older posts if they occurred within the period.
Comments: Total number of comments on your posts during the selected period, even if the content was published earlier.
Shares: Number of times your content was shared during the selected period, regardless of its publication date.
Clicks: Total number of clicks on your content during the selected period, even if the content was published earlier.
Demographics
Percentage of followers by country, region, industry, and job function. Data can be displayed as a chart or table.
The demographics section depends on data provided by the LinkedIn API. If not available, the section will not appear.
See more details about demographic data here.
Posts published in the period
Displays posts published within the selected period. The data shown corresponds to the accumulated performance of each post, from its publication date until yesterday. This allows you to analyze the total performance of your posts, even though the filter only determines which posts are included based on their publication date.
✅ SUMMARY
Engagement: See section What is engagement?.
Interactions: Total number of interactions received on posts, including reactions, comments, clicks, and shares.
Impressions: Total number of times posts were displayed.
Impressions refer to the total number of views when the content occupies at least 50% of the screen for 300 ms, or the total number of clicks on it — whichever occurs first.
Posts: Total number of posts made during the selected period.
✅ INTERACTIONS
Reactions: Total number of reactions on posts.
Comments: Total number of comments on posts.
Clicks: Total number of clicks on posts. Includes clicks on links, buttons, images, or any other interactive elements in the content.
Shares: Number of times posts were shared.
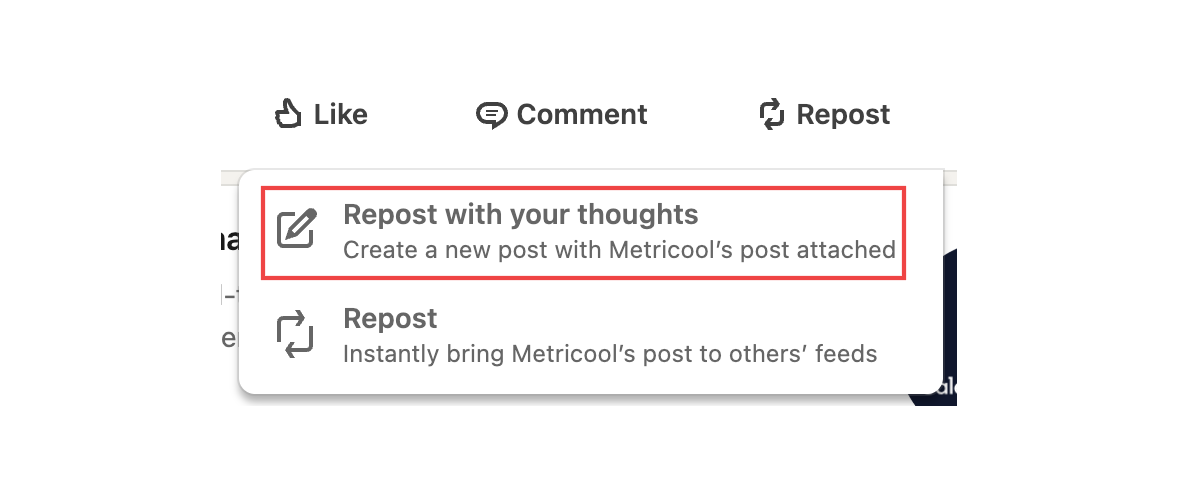
LinkedIn has two types of reposts: one where you add your thoughts and one automatic repost. Only reposts with your own thoughts on the post are counted as shares.
Posts: Metrics showing the total number of posts made during the selected period.
Reactions per post, Comments per post, and Shares per post: Average number of interactions per post included in the period.
Daily reactions, Daily comments, and Daily shares: Average number of interactions per day within the selected period.
✅ POST LIST
Date: Date the post was published.
Type: Type of post (Text, Image, Multi-image, Video, Document, Article, Poll, Celebration).
Reactions: Total number of reactions (like, interesting, etc.) received on the post.
Comments: Total number of comments on the post.
Clicks: Total number of clicks on the post.
Shares: Number of times the post was shared.
Impressions: Total number of times the post was displayed. Includes impressions generated by posts on any date, even outside the selected time period.
Engagement: See section What is engagement?.
Video views: Number of times the video was viewed. Counts videos played for at least 3 seconds. Auto-looped videos are counted as one view even if replayed.
Viewers: Number of unique users who watched the video.
Watch time: Average time the video was watched, displayed in seconds. If the video is auto-looped, this metric continues to increase with each replay.
Average watch time: The average viewing time for that video.
Newsletters
✅ SUMMARY
Engagement: See section What is engagement?.
Interactions: Total number of interactions received on newsletters. Includes reactions, comments, clicks, and shares.
Impressions: Total number of times newsletters were displayed.
Newsletters: Total number of newsletters published during the selected period.
✅ INTERACTIONS
Reactions: Total number of reactions received on newsletters (for example, "like", "celebrate", "interesting"...).
Comments: Total number of comments received on newsletters.
Clicks: Total number of clicks on any interactive part of newsletters (links, buttons, hashtags...).
Shares: Number of times newsletters were shared.
Newsletters: Total number of newsletters published during the selected period.
What is engagement?
Engagement measures how users interact with your content in relation to how visible or far-reaching it is.
In Metricool, you can choose between different calculation formulas.
Note: The engagement of competitors is calculated differently from your own account. We recommend adding your own account as a competitor to make the data comparable.
Learn more here.